Is Hulk an accident?
The same four tests on Wikipedia's Category: Marvel Comics supervillains — 370 nodes where the heroes Hulk, Deadpool and Doctor Doom loom largest, nearly 40% of citations run both ways, and 43 villains nobody links to at all.
The same four tests on Wikipedia's Category: Marvel Comics supervillains — 370 nodes where the heroes Hulk, Deadpool and Doctor Doom loom largest, nearly 40% of citations run both ways, and 43 villains nobody links to at all.
This is the network behind the crawl in data/Marvel_Comics_supervillains: the 370
pages reachable in Wikipedia's Category: Marvel Comics supervillains (redirects resolved;
crawled 2026-09-13), with 1,136 directed edges between them — an edge A→B when B's article
appears on A's. Mean in-degree is 3.07, barely half the hero network's 5.89, and the structure
is frayed at the edges: 46 weakly connected components, 43 characters nobody links to in
either direction, a giant component of 323, and two genuine two-villain islands —
Humus Sapien with Ogre, and Tetu with Zenzi.
The hub race has a plot twist: the most-cited "supervillains" are mostly heroes. Hulk tops the count at 58 in-links, Norman Osborn follows at 50, then Deadpool (25), Thanos (23), and Black Cat and Venom tied at 22 — category leakage, not a labeling error, since villains' articles genuinely cite their heroic nemeses. One genuine stowaway does hide in the node list though: David 8, the android from the Alien franchise, present and fully isolated — the same kind of crawl artifact as Street Fighter's Tifa Lockhart. Is a hub of 58 just what scattering 1,136 links across 370 nodes produces, or does it take something more deliberate? Same order as always: chance, degree-preserving chance, growth, and the individual level.
Erdős–Rényi first: the same 370 nodes and 1,136 directed edges, placed by independent coin-flips. Across 300 offline draws, the biggest hub's in-degree ranged from 7 to 15 (mean 9.36, standard deviation 1.05). Hulk's 58 is above every single draw — about 46 standard deviations above the random mean, and nearly 4× the most extreme draw of 300. Norman Osborn's 50 clears the same ceiling just as decisively. No ambiguity here: chance doesn't build hubs like these. Draw your own random network below and watch its biggest hub land.
Each draw independently places 1,136 directed edges among 370 nodes at random (no self-loops, no repeats) and plots the resulting in-degree CCDF against the real network's.
The tighter null: keep everyone's exact in- and out-degree fixed, scramble only who links to whom — repeatedly take a chain a→b, b→c, c→d and rewire it to a→c, c→b, b→d. Two statistics:
Across 300 offline shuffles (3,000 swaps each): clustering's null mean was 0.0763 (sd 0.0069) — the real value sits about 19 standard deviations above it, beyond all 300 shuffles (empirical p ≈ 0). Reciprocity's null mean was 0.0481 (sd 0.0079) — the real value sits about 44 standard deviations above that, again beyond every shuffle. Degree alone doesn't explain this network's triangle-heavy structure or its unusually mutual citation habits — villain articles name each other back at a rate random wiring can't touch.
The chart below starts pre-populated with shuffles, so the null distribution is visible immediately — pick a statistic, or run more yourself.
How unusual is the real network?
StatisticEach shuffle is a fresh copy of the real network, swapped from scratch (not a running chain), matching the offline method above but with fewer swaps per realization for responsiveness. 40 run automatically on load; use the button for more.
One more thing we checked offline but didn't add as a control: do the two villain islands — Humus Sapien with Ogre, Tetu with Zenzi — ever reconnect to the giant component under this shuffle? Across all 300 realizations, the giant component stayed exactly 323 nodes, every time (standard deviation 0) — not by chance, but by construction: a swap only ever rewires edges along an existing directed walk (a→b→c→d), which can never cross between two components with no edges between them. This null can't even ask whether the islands would reconnect — the component split is invariant by construction, not by result. That's why it isn't offered as a third toggle above: a histogram with zero variance wouldn't be testing anything.
Preferential attachment: grow to 370 nodes one at a time, and give each newcomer m outgoing links to existing characters — chosen with probability proportional to how many in-links they already have. The classic rich-get-richer mechanism, in its directed citation-network form (the Price model), which fits our directed network better than the usual undirected Barabási–Albert setup. Out-degree is exactly m for every non-seed node by construction; in-degree accumulates by preference.
This is a generative hypothesis tested against the data — not a claim about how the Wikipedia article network actually got written.
At m=3 (3×370 = 1,110 edges, close to the real 1,136), 50 offline trials all produced a bigger hub than Hulk: max in-degree 86–175 (mean 120) against the real 58 — preferential attachment doesn't just reproduce a big hub here, it more than doubles it. Even at m=2 (mean 88, range 55–113) every trial overshoots; at m=4 the gap widens further (mean 137). Lowering m brings the hub down but pulls the edge count further from 1,136 — no single m matches both density and hub size. And at every m, every trial: one connected component, zero isolates — versus the real network's 43 isolates and two two-villain islands. A model where everyone who joins immediately attaches can't produce a villain nobody ever mentions.
Move the slider and regenerate to see for yourself.
Grows a fresh directed preferential-attachment network to n=370 nodes with the chosen m, then plots its in-degree CCDF against the real network's.
Preferential attachment depends on history: characters arrive one at a time, and each newcomer is more likely to connect to whoever's already popular, so an early lead can snowball into a hub like Hulk. But what if the villain universe was born all at once?
If all 370 characters existed simultaneously, there'd be no established popularity for a newcomer to follow — everyone would start with the same shot at new connections. That's the counterfactual below: a second model, same 370 characters and roughly the same edge budget, that links nodes uniformly at random instead of preferring the well-connected. It's not a claim about how Marvel's Wikipedia network actually came to exist — it's a way of asking how much of the hub structure could come from history alone.
Sequential growth adds one character at a time, wiring each newcomer's m links proportional to how connected existing characters already are (the same rule as above). Big Bang creates all 370 at once and wires the same m links per character uniformly at random — no regard for who's already connected. Switch models or click "New universe" for a fresh run; node size shows degree, and the largest hub is highlighted in gold. Hover a node (mouse only) for its name and degree.
Hover a node to see who occupies it and how connected it is in this run.
Run each model a few times at the same m. Big Bang spreads connections fairly evenly — most nodes end up a similar, modest size, and the largest hub barely varies run to run. Sequential growth, at that same m, reliably produces one or two stand-out characters, because whoever gets ahead early keeps attracting a disproportionate share of new links. That's the mechanism in miniature: Hulk's 58 real in-links aren't just abstract "popularity" — in a growing network, being popular early is itself an advantage that compounds. In a universe born all at once, there's no "early" for that advantage to attach to.
None of this shows preferential attachment is what actually produced the real Wikipedia network — the CCDF comparison above already found PA, at the edge-matched m, reliably overshoots Hulk's real in-degree. What it does show is why network history can matter: a heavy-tailed degree distribution is consistent with a growth-plus-preference story, but consistent isn't proof — this counterfactual just isolates what history specifically contributes.
Definitions: on the undirected projection (same one used for clustering above), a character's degree is their number of distinct neighbors, and their average neighbor degree is the mean degree of those neighbors. Network-wide, ⟨k⟩ = 4.919, while the edge-weighted mean neighbor degree ⟨k²⟩⁄⟨k⟩ = 13.18 — nearly triple. That gap is the friendship paradox. It's worth stating plainly that ⟨k²⟩⁄⟨k⟩ is a pure function of the degree sequence, so it's mathematically guaranteed to survive a degree-preserving shuffle — not something this page needs to test.
What isn't guaranteed is what it looks like character by character. Of the 327 connected characters, 274 (83.8%) have neighbors who are on average more connected than they are; 44 (13.5%) out-rank their average neighbor, and 9 are exactly tied. Fifteen characters are never out-popularitied by any neighbor at all — the local degree champions, from Hulk at the top of the giant component to Ogre and Humus Sapien inside their own two-villain island, each merely the biggest fish in a pond of one relationship.
Search for a villain below to see their own numbers.
Each dot is one connected character (own degree vs. average neighbor degree, log-log). The dashed diagonal marks equality: above it, your neighbors out-rank you on average; below it, you out-rank them. Click a dot or search a name.
No character selected yet — click a dot or find one above.
We plotted the in-degree CCDF P(K ≥ k) on the frozen snapshot (370 characters,
1,136 directed links) against two nulls: an ER random graph, whose in-degree
is exactly Poisson with λ = 1,136/370 ≈ 3.07,
and a 200-seed ensemble of directed Price graphs (N = 370,
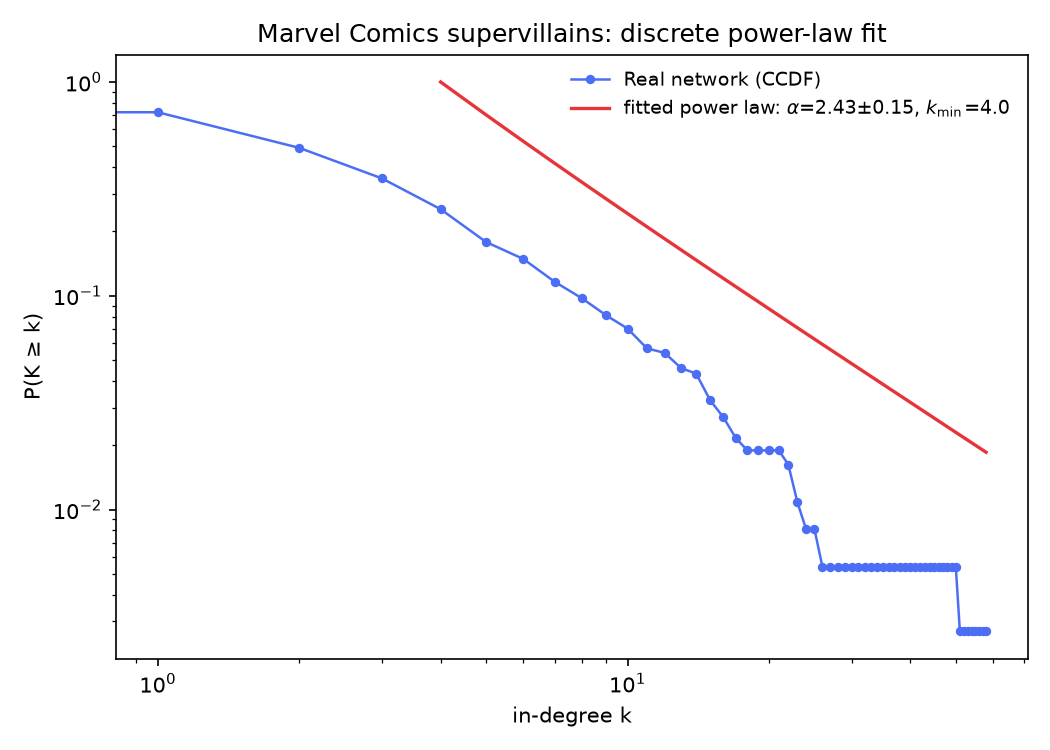
m = 3 — edge-matched), with the ensemble maximum marked. A discrete power-law fit
(Clauset–Shalizi–Newman MLE, via the powerlaw package) then summarizes the tail:
exponent α̂ with its standard error, and a self-selected cutoff k̂min.
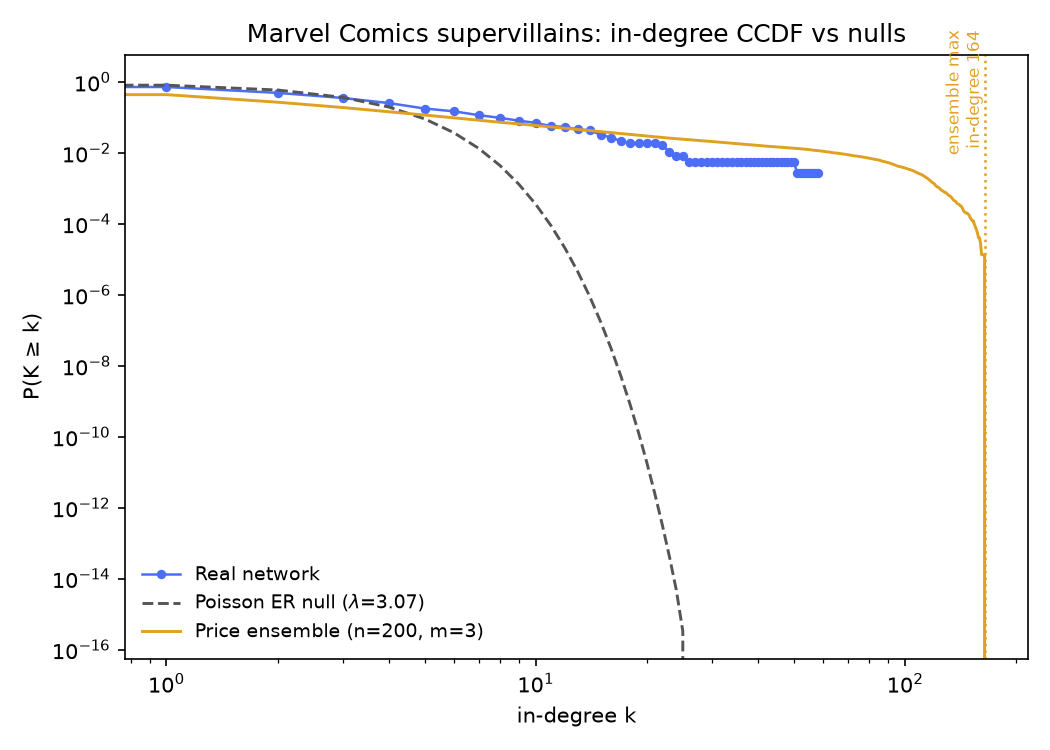
Not random. Under ER with λ = 3.07, a character with in-degree 12 or more should essentially never exist — expected count 0.033 across all 370 nodes, real count 20. A degree of 58 is off the Poisson scale by 1.3 × 10−49 expected occurrences in a network of this size: the gray curve exits the chart by k ≈ 12, while the real network still has 7 characters at k ≥ 20.
Lighter than Price. The fitted exponent (α̂ = 2.43) sits well below Price/BA's theoretical 3.0 (smaller exponent = heavier tail), but the ensemble comparison points the other way at the extreme: every one of the 200 Price seeds produced a hub above Hulk's 58 (ensemble max 164, mean 118). Forced to choose between random and Price: Price, easily — it just overstates this network's skew at the very top, the same overshoot the growth section found.
Neither, strictly. The power law describes the tail, not the whole network: only 94 of the 267 cited characters sit in the fitted region, 103 characters were never cited at all, and a network this small carries wide uncertainty on α̂. "Scale-free-looking tail" is as far as this data goes.
What we can't conclude (for this question):
Pulling the four sections together:
So: no, Hulk isn't an accident of scale or density. Something like rich-get-richer growth fits the real hub structure far better than any random baseline — but that's a hypothesis this data is consistent with, not something these four tests prove happened, and even its best-fitting version overshoots the real hub while structurally ruling out the 43 characters nobody bothered to link to. The villains' verdict rhymes with the heroes': heavy tail, real structure, model in the right neighborhood — and one stowaway android from a different franchise entirely.
analysis/build_week2_reference.py and
analysis/build_week2_fit_reference.py, run against the frozen
data/Marvel_Comics_supervillains/ crawl (2026-09-13), writing
villains_week2_summary.json in the same directory. Every interactive figure
recomputes its own live version of the same algorithm in your browser — nothing here is
hand-typed separately from the code that produced it.